

One of my favorite tools for quickly evaluating and comparing processor and memory performance on a database server is Geekbench 3 from Primate Labs. Primate Labs just released the completely rewritten Geekbench 3.0 on Aug 16, 2013, and the latest version is Geekbench 3.02.
Geekbench developer John Poole describes Geekbench 3 like this: “Geekbench 3 includes 15 new benchmark tests that are designed to model real-world processor intensive tasks. The new tests cover a number of different application domains, including encryption, image processing, signal processing, and physics simulation. Geekbench 3 also includes 12 completely rewritten benchmark tests from Geekbench 2. These tests are now more representative of real-world applications and usage scenarios.”
Geekbench is a cross-platform, processor and memory benchmark that quickly measures both integer and floating-point processor performance along with your memory performance on a computer in just a couple of minutes, without requiring (or allowing) any configuration whatsoever. You just install Geekbench, unlock your license, and run the program, and you will see the results in roughly two-three minutes. You can then decide whether you want to upload your results to the Geekbench online database, either anonymously or using a Geekbench account. By design, Geekbench does not measure I/O performance.
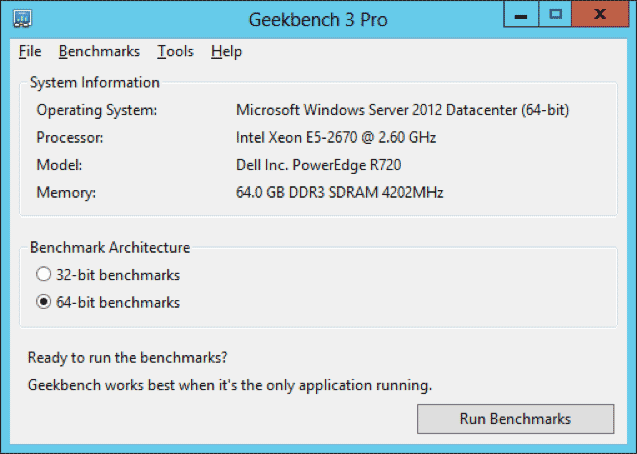
Figure 1: Geekbench 3 Main Screen
Geekbench Scores
Geekbench 3 has an overall Single-Core Score and an overall Multi-Core Score, along with individual scores for each one of the twenty-seven tests in the benchmark. The single-core score is very useful for evaluating single-threaded processor and memory performance, which is very important for SQL Server OLTP workloads (since most OLTP queries end up only running on a single processor core). The multi-core score is useful for evaluating the multi-threaded processor and memory performance of the entire machine.
With SQL Server 2012 core-based licensing, you want to make sure you are getting the best single-threaded performance possible from each physical processor core that you have to buy a relatively expensive SQL Server 2012 core license for. The Geekbench 3 Single-Core score is one quick and easy way to measure both single-threaded processor and memory performance.
Geekbench Usage Scenarios
One handy usage scenario for Geekbench 3 is to confirm that your processor cores are not being throttled back due to software or hardware-level power management. Modern Intel and AMD processors can reduce their electrical power usage when they are not under a heavy workload by reducing their current core speed. This is a good way to increase battery life on a laptop or tablet, but it is not a good idea for a mission-critical database server. The problem is that the core speed of the processors does not react quickly enough (depending on the processor model) to an increase in load to avoid hurting performance, especially for short duration OLTP-type queries.
By default, Windows Server 2008 and newer use the Balanced Power Plan when they are first installed. You should make sure to change this setting to use the High Performance Power Plan on your database server, but you should be aware that the BIOS-level hardware power management setting can override the Windows Power Plan. This means that even though you have the Windows Power Plan set to High Performance, the processor core speed may still be reduced to less than the rated base clock speed of the processor.
You can detect this problem by using the free CPU-Z utility (as shown in Figure 2) to see the current Core Speed of Core #0 of the current processor. If the current Core Speed is significantly less than the rated, base clock speed of your processor, you have either software or hardware (or both) power management in effect. It is sometimes harder to figure this out with the latest Intel processors when they are not under any load, so you can use Geekbench 3 to put some intense load on your processor. While Geekbench 3 is running, watch the current Core Speed on CPU-Z to make sure the processor is running at or actually above the rated base clock speed of the processor during the test.
Intel Turbo Boost 2.0 allows individual processor cores to run above their rated base clock speed when the operating system requests the highest processor performance state (P0) if they’re operating below power, current, and temperature specification limits for the entire processor. This is an effective and useful feature, especially for OLTP database server performance.
If you have your hardware and software power management configured correctly and you have Turbo Boost enabled in the BIOS, you should see your processor cores periodically run at higher than their normal base clock speed while you are running Geekbench 3 (as you see in Figure 2 and Figure 4).
Your will also see differing Geekbench 3 scores based on your overall hardware and software power management configurations and the exact processor that you are using. Older 45nm Intel Nehalem and 32nm Intel Westmere processors are affected more by power management settings than newer 32nm Intel Sandy Bridge, 22nm Intel Ivy Bridge, or 22nm Intel Haswell processors.
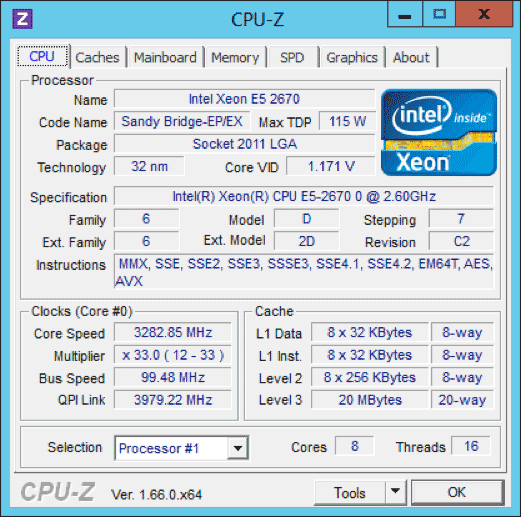
Figure 2: CPU-Z Display of Dell PowerEdge R720 System Running Geekbench 3
Your overall Geekbench 3 scores and your Geekbench 3 memory scores are also affected by your memory type and configuration. For example, depending on the processor (where the memory controller is), it can make a pretty significant difference how exactly how many memory modules are populated and exactly what slots are populated. It also makes a difference whether you have 1333MHz memory modules, 1600MHz memory modules, or 1866MHz memory modules (1866MHz is supported by the upcoming Intel Ivy Bridge-EP). Dell has an online memory configuration utility for their 12th Generation servers that can help you configure your memory correctly, but you can use the memory scores in Geekbench 3 to validate that you are getting better performance after a memory configuration change.
Figure 3 and Figure 5 show the Geekbench 3 results for a two-socket Dell PowerEdge R720 server with two, 32nm Intel Xeon E5-2670 Sandy Bridge-EP processors compared to a single-socket desktop system with a newer and faster 22nm Intel Core i7-3770K Ivy Bridge processor (that is also mildly over-clocked).
The faster clock speed Ivy Bridge system has a much higher Single-Core score than the lower clock speed Sandy Bridge server system. Ivy Bridge also has some minor architectural improvements that improve its performance slightly compared to Sandy Bridge.
Running Geekbench 3 only takes about two-three minutes, and it gives you a wealth of useful information about your processor and memory performance. Even if you are unable or unwilling to run Geekbench on your database servers (during a maintenance window or before they are deployed to production), you can still take advantage of the online Geekbench database of scores to find a similar system to what you want to evaluate.
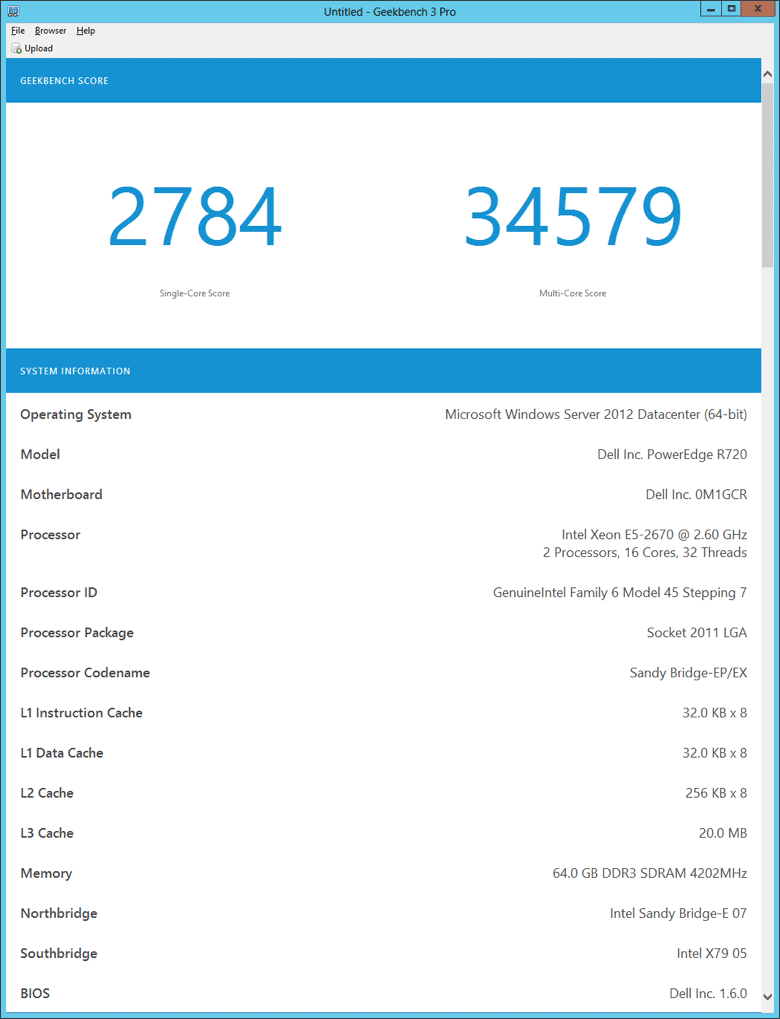
Figure 3: Dell PowerEdge R720 64-bit Geekbench 3 Results
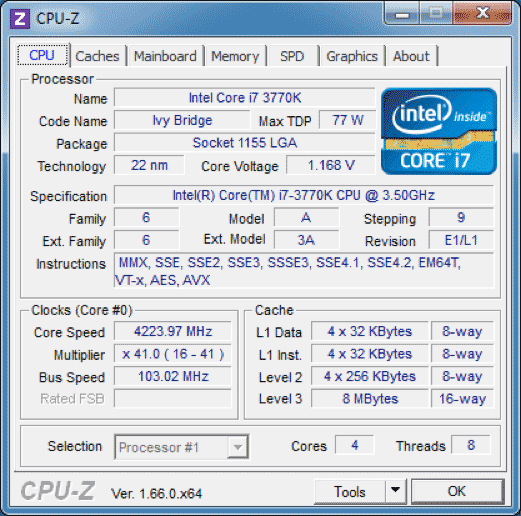
Figure 4: CPU-Z Display of Ivy Bridge Core i7-3770K Desktop System Running Geekbench 3
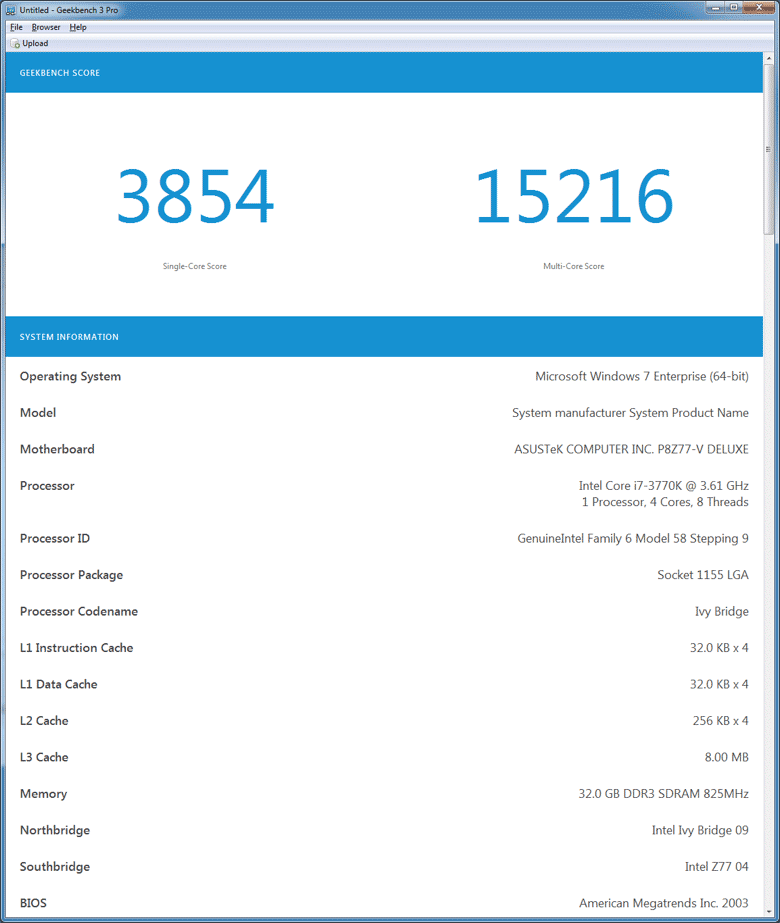
Figure 5: Ivy Bridge Core i7-3770K Desktop System 64-bit Geekbench 3 Results